


Data is everywhere, but raw data alone isn’t helpful. It needs to be cleaned, organized, and processed into meaningful information. This transformation is what we call data processing, and it plays a crucial role in everything from business decisions to technological innovations. Whether you’re dealing with real-time data streams, preparing datasets for machine learning, or analyzing geospatial data, understanding data processing is essential to make the most of your information.
In this guide, we’ll explore the key concepts, methods, and tools of data processing, helping you unlock its potential for your goals.
Table of Contents
What is Data Processing?
Data processing is the act of transforming raw data into meaningful information. It is a key step that comes immediately after data collection. Imagine gathering a pile of unorganized data—what’s next? This is where data processing begins.
The process takes raw, unstructured data and organizes it. It cleans errors, removes duplicates, and prepares it for analysis. The goal is to make the data useful and insightful. Without data processing, raw data is often too messy to be of value.
Data processing is used in everything from generating business reports to creating models in machine learning. It ensures data is ready to answer important questions. How are trends changing? What decisions should be made? The answers often lie in well-processed data. In today’s automated world, efficient data processing is essential for businesses aiming to make accurate, data-driven decisions.
Geospatial data, which includes geographic coordinates, boundaries, and locations, also undergoes this process, though it comes with some unique considerations. In geospatial data processing, it’s important not only to clean and organize data but also to ensure spatial accuracy, such as aligning data to the correct coordinate reference system (CRS) and handling spatial relationships like proximity or containment.
Whether dealing with general data or geospatial data, the principles of data processing remain the same. The key difference is that geospatial data involves additional steps like georeferencing or working with spatial databases to preserve location-based accuracy and to enable advanced spatial analysis.
Data Processing Cycle
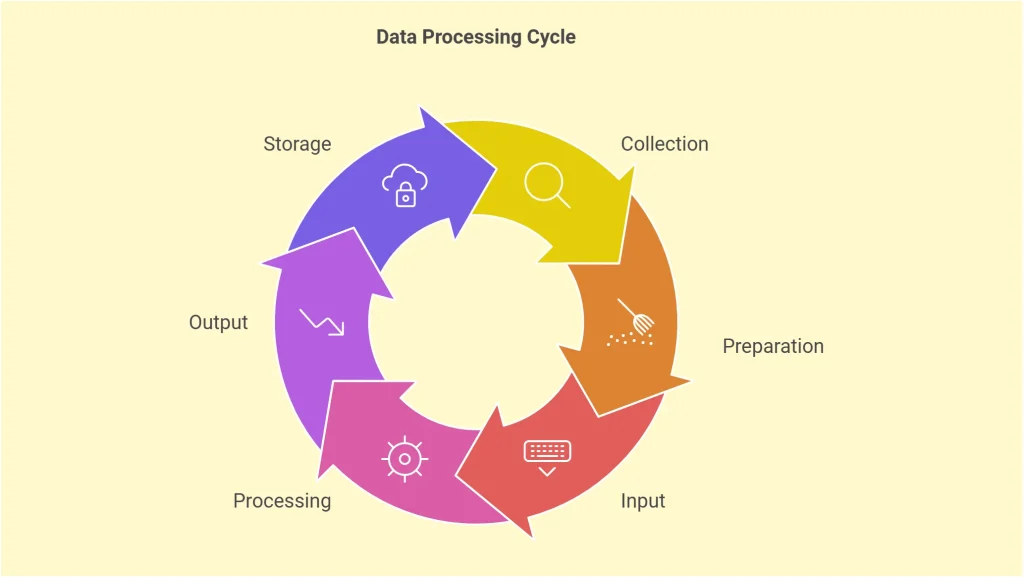
The data processing cycle is a structured series of steps that transforms raw data into meaningful information. It outlines the journey data takes from initial collection to final storage, ensuring accuracy and usability at each stage. Let’s explore each phase of the cycle:
1. Collection
Data processing begins with collection. This step involves gathering raw data from various sources such as surveys, sensors, transactions, or databases. The quality of the collected data is crucial, as errors or gaps at this stage can affect the entire process.
Key aspects:
- Ensuring data is relevant and accurate.
- Using reliable sources to minimize inconsistencies.
For geospatial data, collection can involve specialized sources, such as GPS devices to capture coordinates, remote sensing technologies (e.g., satellite images) for capturing large-scale geographical data, or sensor networks (e.g., IoT devices) that collect data with location-based context. Crowdsourced platforms like OpenStreetMap or Google Maps can also provide valuable geospatial data, especially in areas lacking formal data sources.
2. Preparation
Once collected, data must be organized and cleaned. This is the preparation stage, where issues like duplicates, errors, or inconsistencies are resolved. Preparation also involves structuring the data into a format suitable for analysis.
Tasks include:
- Data cleaning: Removing errors and irrelevant information.
- Formatting: Structuring data for easier input and analysis.
For geospatial data, preparation often requires ensuring that geographic information is aligned with the correct coordinate reference system (CRS). This might involve transforming or reprojecting data from one spatial reference system to another (e.g., from WGS84 to UTM). Additionally, any geometric errors such as invalid polygons in geographic shapes must be corrected.
3. Input
In the input stage, the prepared data is entered into a processing system. This can be manual (e.g., data entry by a person) or automated (e.g., system imports from a database). Proper input ensures that the data is ready for analysis or further transformation.
Key tools:
- Data entry software.
- Automated data pipelines for electronic systems.
For geospatial data, this often involves importing spatial data formats like Shapefiles, GeoJSON, or GeoTIFFs into specialized Geographic Information System (GIS) software or spatial databases. The input process may also involve integrating geospatial data with other types of datasets for enhanced analysis (e.g., linking location data with business metrics).
4. Processing
The processing stage is where the magic happens. Here, data is analyzed, transformed, and interpreted using algorithms or computational methods. Depending on the purpose, this step might include calculations, sorting, filtering, or even machine learning.
Examples:
- Summarizing data for a business report.
- Applying algorithms to detect patterns or trends.
For geospatial data, this stage often includes performing spatial operations such as buffering (creating a zone around a feature), spatial joins (linking data based on geographic location), and geometric transformations (e.g., converting between vector and raster formats). Geospatial analysis can also include spatial clustering, heatmaps, and identifying spatial relationships such as proximity or intersection between geographic features.
5. Output
The processed data is then presented in a usable format during the output stage. Outputs can take many forms, such as:
- Reports and dashboards.
- Graphs or visualizations.
- Actionable datasets for decision-making.
For geospatial data, the output often comes in the form of maps or spatial visualizations, like heatmaps, interactive geographic dashboards, or 3D terrain models. Tools like Google Earth, QGIS, ArcGIS, or Dashsi can generate these outputs. In some cases, geospatial data might be represented as layers on maps or overlaid with other business data to uncover geographic patterns and trends.
6. Storage
The final stage is storage. Processed data is stored securely for future use or reference. Proper storage ensures data remains accessible and organized for reporting, analysis, or legal compliance.
Common storage solutions include:
- Cloud systems for scalability.
- Databases and data warehouses.
- Secure physical or electronic archives.
For geospatial data, storage typically involves spatial databases like PostGIS (for PostgreSQL) or cloud-based services like AWS S3 and Google Cloud Storage, which support the storage of large geospatial datasets with proper indexing. The data needs to be organized in a way that allows for fast querying of spatial attributes, like distances, areas, or intersections.
The Cycle in Action
The data processing cycle is continuous. For instance, stored data may be revisited and reprocessed as new needs arise or additional data becomes available. By following these steps, organizations can ensure their data is accurate, actionable, and valuable at every stage.
Data Processing Steps
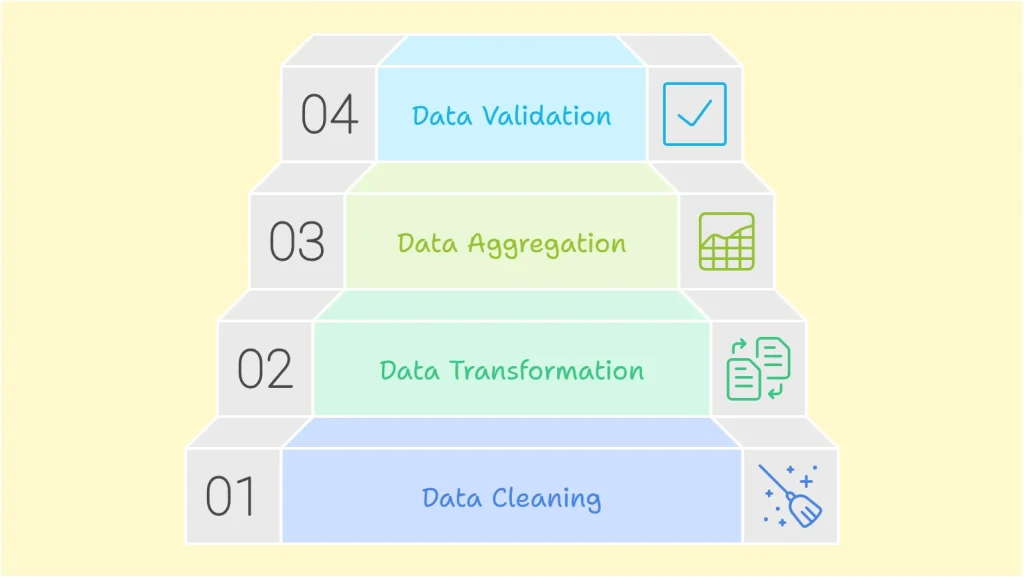
The process of turning raw data into actionable insights involves several essential steps. These steps ensure the data is accurate, meaningful, and ready for analysis. Here are the key steps in data processing, with additional insights where applicable:
1. Data Cleaning
Data cleaning is the foundation of effective data processing. It involves removing errors, inconsistencies, and irrelevant information to ensure the data is accurate and reliable. Without this step, flawed data can lead to incorrect conclusions.
Key tasks in this step include:
- Removing duplicates.
- Filling in missing values.
- Correcting errors, such as typos or incorrect formatting.
For geospatial data, this often involves verifying the geometry of spatial features (e.g., ensuring that polygons are closed and valid) and cleaning any misaligned or incomplete coordinates.
2. Data Transformation
Once the data is clean, it often needs to be restructured or converted into a usable format. Data transformation involves adjusting the data to meet the requirements of the processing system or analysis tools.
Examples of transformation tasks:
- Converting data types (e.g., text to numeric values).
- Normalizing or scaling numerical data for machine learning.
- Reshaping data structures, such as pivoting tables or splitting columns.
Geospatial data may need to be transformed between coordinate systems, or projected, which means converting from a global coordinate system (e.g., lat/long) to a local coordinate system (e.g., UTM).
3. Data Aggregation
Aggregation combines data from multiple sources or datasets to create a comprehensive view. This is especially useful for generating summaries, calculating averages, or identifying overall trends.
Examples include:
- Summing up sales data by region.
- Grouping customer data by demographic for analysis.
- Merging datasets from different departments into a unified database.
Aggregating geospatial data often requires combining spatial datasets based on geographic boundaries (e.g., summing sales by region or aggregating population data by district).
4. Data Validation
Data validation ensures the processed data is accurate, consistent, and adheres to predefined rules. It’s a crucial step for verifying that the data meets quality standards before further analysis or reporting.
Validation checks can include:
- Verifying data formats (e.g., dates, numeric ranges).
- Checking for logical consistency (e.g., ensuring a total matches the sum of its parts).
- Confirming data completeness.
For geospatial data, this involves validating spatial relationships and ensuring that the data conforms to rules such as topological correctness (e.g., no overlapping polygons or unconnected lines).
Additional Steps to Consider
Depending on the complexity of the data and its intended use, there may be additional steps in the data processing workflow:
- Data Integration: Combining multiple datasets, often from diverse sources, to provide a unified view.
- Data Reduction: Simplifying datasets by eliminating redundant or irrelevant data to improve processing efficiency.
- Data Encoding: Converting data into machine-readable formats, such as encoding categorical variables for machine learning models.
Types of Data Processing
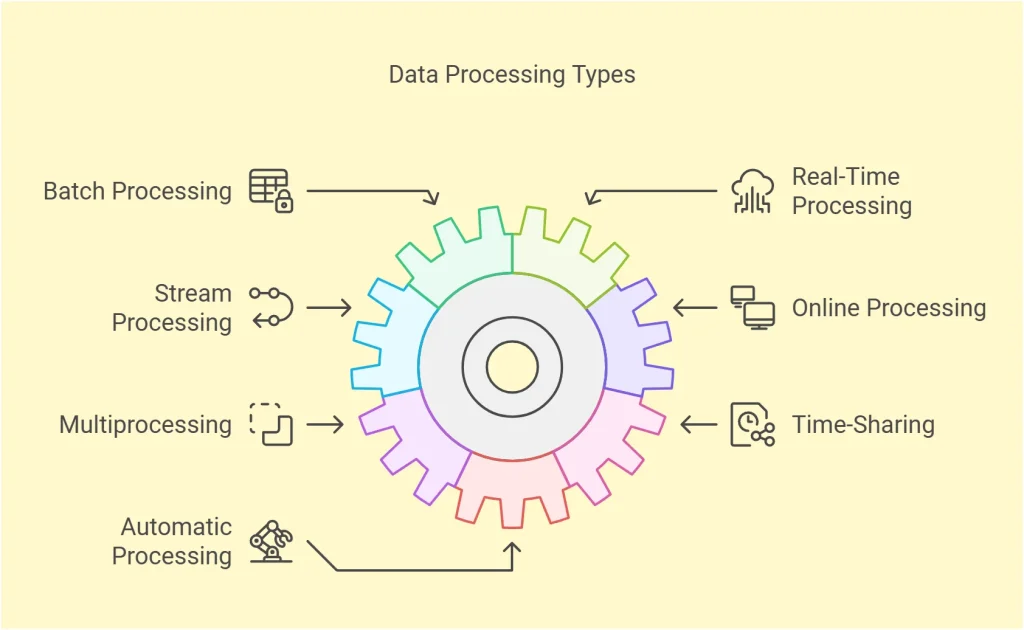
Data processing comes in various forms, each designed to handle specific needs and scenarios. Choosing the right type depends on factors like the speed of data input, the volume of data, and the purpose of processing.
The type of data processing you choose can directly affect your results. Do you need quick decisions? Are you handling massive data at intervals? Understanding these types helps you select the right approach for your data needs.
For geospatial data, the type of processing can be influenced by factors like data size, geographic scope, and the need for real-time spatial analysis. For example, processing satellite imagery or sensor data from GPS devices may require specific processing methods depending on how quickly decisions need to be made and how much data is involved.
1. Batch Processing
Batch processing handles large volumes of data in groups or batches. It processes data at scheduled times rather than immediately. This is ideal for tasks like payroll systems, bank reconciliations, or processing large sets of transactional data. It’s efficient but not suitable for real-time needs.
For geospatial data, batch processing can be particularly useful when dealing with large datasets such as satellite imagery or geospatial surveys. These datasets often need to be processed in chunks, especially when creating spatial models or performing large-scale land-use classification. Processing data in batches ensures efficiency but may not be appropriate for scenarios requiring up-to-the-minute spatial insights, like real-time navigation systems.
2. Real-Time Processing
Real-time processing analyzes data as it is received. This method is crucial when immediate action is required, such as monitoring financial transactions for fraud or processing sensor data in IoT devices. Speed and accuracy are key in real-time processing systems.
For geospatial data, real-time processing is critical in scenarios such as GPS tracking, real-time traffic monitoring, or location-based services. In these cases, the system must continuously process and update geospatial information, such as locations or routes, in real time to make immediate decisions (e.g., rerouting traffic, updating delivery paths, etc.).
3. Stream Processing
Stream processing focuses on continuous data flows. Unlike batch processing, it processes data in motion, enabling near-instant insights. This is common in live video analytics, stock market monitoring, and social media platforms. It’s an extension of real-time processing but specialized for unending streams of data.
For geospatial data, stream processing is often used in IoT sensor networks, where geospatial data is continuously generated (e.g., weather stations, GPS trackers, or environmental monitoring stations). Processing this data in real-time allows for continuous tracking of geographic events, such as changes in temperature or air quality, and provides near-instantaneous insights for decision-making.
4. Online Processing
Online processing, also known as transaction processing, is interactive. It processes data instantly as users input it. For example, when you book a flight or transfer money online, the system processes your data and updates records in real time. It’s heavily used in e-commerce and banking.
In the context of geospatial data, online processing can be applied to location-based services (e.g., when users check in via a mobile app or make real-time updates to a map). As users provide location-based data, systems like Google Maps, Uber or Fleetsi update geospatial information to provide accurate, real-time services.
5. Multiprocessing (Parallel Processing)
Multiprocessing splits tasks across multiple processors to increase efficiency. It’s used when large datasets or complex computations require high performance. In scientific research, simulations, or AI training, parallel processing is essential for reducing time and effort.
For geospatial data, multiprocessing can be used to process large spatial datasets simultaneously. This is especially useful in remote sensing applications, such as processing satellite images or LiDAR data, which are often too large to handle with single-process systems. Multiprocessing can also speed up geospatial computations like spatial interpolation or modeling geographic features.
6. Time-Sharing
Time-sharing systems allocate computing resources to multiple users or processes simultaneously. It ensures that multiple tasks are handled efficiently by dividing processor time into small intervals. This is common in environments where many users interact with the system at once, such as universities or shared network systems.
For geospatial data, time-sharing systems can be used in environments that require multi-user access to geospatial data, such as in shared GIS platforms. Multiple users can access and process spatial layers simultaneously, enabling collaboration and faster decision-making, especially in large organizations that rely on location-based data.
7. Automatic Processing
Automatic data processing uses software and algorithms to perform tasks without human intervention. It reduces errors and speeds up repetitive processes. Examples include data validation in spreadsheets, automated report generation, or machine learning pipelines.
In the context of geospatial data, automatic processing can include automated classification of satellite imagery, machine learning models for land use detection, or automated geospatial data cleaning. These processes ensure that large geospatial datasets can be analyzed efficiently, reducing the need for manual intervention.
Data Processing Methods
Data processing methods define how raw data is handled and transformed into useful information. Over the years, these methods have evolved significantly with advancements in technology. Each method has its own characteristics, advantages, and limitations, depending on the tools and systems used. Here are the main data processing methods:
1. Manual Data Processing
Manual data processing relies entirely on human effort. People collect, organize, and process the data without the use of machines or automated systems. This method is often used when dealing with small datasets or when human judgment is required.
For example:
- Sorting and recording data by hand.
- Creating physical spreadsheets or ledgers.
For geospatial data, manual processing might involve tasks like digitizing maps, where a person manually traces boundaries, roads, or other geographic features on a map. It’s also common when entering small-scale location data, such as individual GPS coordinates or addressing discrepancies in geospatial datasets.
While manual data processing is simple and cost-effective for small tasks, it is time-consuming, prone to errors, and not scalable for large datasets. This is especially true for geospatial data, where datasets can grow exponentially in size and complexity, requiring more automated approaches.
2. Mechanical Data Processing
Mechanical data processing uses basic mechanical devices to assist in processing data. Devices like calculators or typewriters were traditionally used for this purpose. This method marked a significant improvement over manual processing by reducing errors and speeding up repetitive calculations.
Examples include:
- Early accounting machines.
- Mechanical tabulators used for census data.
For geospatial data, mechanical devices could have once been used for basic map plotting or early coordinate-based calculations. However, as with many data domains, this method has been largely replaced by modern electronic systems. Geospatial data, especially when it involves large-scale geographic areas (like mapping a country or region), requires more powerful, automated systems to handle the complexity and volume.
Today, mechanical data processing is rarely used, having been largely replaced by electronic methods, which are faster and can handle significantly larger, more complex datasets—especially important in the geospatial realm.
3. Electronic Data Processing (EDP)
Electronic data processing is the most advanced and widely used method today. It involves the use of computers and software to handle large volumes of data efficiently and accurately. EDP is fast, scalable, and capable of processing complex datasets with minimal human intervention.
Examples of electronic data processing include:
- Automated data entry and analysis.
- Cloud-based data processing systems.
- Machine learning and artificial intelligence applications.
In geospatial data processing, EDP is particularly important as it enables complex spatial analysis and mapping. For example, satellite imagery and remote sensing data require significant computing power to process. Systems like Google Earth Engine, ArcGIS, and QGIS utilize EDP to analyze geospatial data, perform spatial joins, and map complex geographic features. EDP also allows for real-time geospatial data processing, such as monitoring the movement of weather systems or tracking vehicles using GPS.
This method enables real-time processing, complex analytics, and integration across multiple systems. It is ideal for businesses, governments, and organizations working with high volumes of data, including geospatial data which often involves large datasets from sources like satellite imagery or IoT sensor networks.
4. Hybrid Methods (Emerging Trend)
In modern applications, hybrid approaches are gaining traction. They combine manual oversight with electronic systems for quality control or use automated workflows to integrate mechanical tasks. For example:
- Using AI for data analysis while humans validate final decisions.
- Semi-automated systems for specific industries, such as healthcare or finance.
For geospatial data, hybrid methods could include combining automated image processing algorithms with human validation to ensure accuracy, especially in land use classification or object recognition from satellite images. In sectors like urban planning or environmental monitoring, a hybrid approach could be used to combine automated spatial analysis with expert review, ensuring that geospatial models reflect on-the-ground reality.
These hybrid methods are particularly useful for geospatial data in cases where high accuracy is required but the data volume is large, such as real-time mapping of natural disasters or GPS-based location tracking in urban environments.
Choosing the Right Method
The choice of data processing method depends on the volume, complexity, and purpose of the data. Manual methods are suitable for small, low-risk tasks, while electronic methods dominate large-scale operations that demand speed and precision.
For geospatial data, the volume and complexity of the data typically lean toward electronic and hybrid methods, especially in tasks that involve mapping, satellite data processing, or large-scale geographic analysis.
As technology continues to advance, electronic and hybrid methods will remain at the forefront, offering innovative solutions to manage the ever-growing demands of data processing, including for geospatial applications. For example, the combination of machine learning models with GIS software will allow for better predictions and analyses of spatial patterns, such as identifying areas at risk of flooding or urban sprawl.
Tools and Technologies for Data Processing
Data processing tools can be grouped into categories based on their purpose and functionality. Here are the most essential groups of tools, along with examples:
- Spreadsheet Tools: Spreadsheet software is perfect for handling small-scale data processing tasks. These tools are widely used for tasks like data cleaning, aggregation, and basic analysis. Tools like Microsoft Excel and Google Sheets can handle geospatial data in basic forms (e.g., lat/long coordinates). Advanced features, like mapping in Excel, allow for rudimentary geospatial analysis.
- Database Management Systems (DBMS): DBMS tools are designed for storing, querying, and managing structured data efficiently. They are essential for handling large datasets in an organized way. Examples are MySQL and PostgreSQL. Databases like PostGIS and MongoDB have spatial support, enabling users to perform spatial queries on geospatial data, such as finding the nearest store or calculating areas.
- Big Data Frameworks: These frameworks are used for processing massive datasets across distributed systems. They are ideal for businesses and organizations dealing with high-volume data. Tools like Apache Hadoop and Apache Spark can handle large-scale geospatial data for distributed analysis. These frameworks are often used for processing massive datasets like satellite imagery or sensor networks.
- Cloud-Based Platforms: Cloud platforms offer scalable and distributed solutions for data storage and processing. They are ideal for large-scale and collaborative data processing. AWS and Google Cloud provide specialized tools for managing and processing geospatial data, such as AWS Lambda for geospatial data pipelines or Google Earth Engine for satellite imagery analysis.
- Real-Time Data Processing Tools: These tools process data as it is generated, enabling instant insights. They are commonly used for real-time monitoring and analytics. Examples are Apache Kafka and Apache Flink.
- Data Visualization Tools: These tools help turn processed data into visual insights. They allow users to create charts, dashboards, and reports to make data understandable and actionable. Tools like Power BI, Dashsi and Tableau can visualize both general and geospatial data on maps, creating insights from spatial patterns.
By leveraging tools from these categories, businesses and individuals can manage and process data efficiently, no matter the scale or complexity.
Conclusion: Turning Data into Insights
Data processing is more than a technical step; it’s the bridge between information chaos and actionable insights. From data cleaning and transformation to real-time processing and automation, every stage matters. Businesses that embrace modern tools and efficient processes can make smarter, faster decisions backed by clean, structured data.
Whether you’re preparing data for machine learning or simply trying to improve your reports, mastering data processing is a must. Take the next step—evaluate your current data workflows and invest in the right tools to stay ahead. Data is powerful, but only when it’s processed right.


