


Today data is everywhere—but numbers and charts by themselves don’t solve problems. To truly unlock the value of data, we need to analyze it. Data analysis transforms processed data into knowledge that drive decisions, uncover trends, and even predict the future. It’s the bridge between organized data and informed decisions.
This guide explores what data analysis is, its various types, the tools used, and how you can leverage it effectively. If you’re new to data processing, check out our guide on data processing to understand how raw data is prepared for analysis.
Table of Contents
What is Data Analysis?
Data analysis is the process of examining, organizing, and interpreting data to extract meaningful insights that inform decisions and solve problems. While data processing focuses on cleaning and structuring raw data, data analysis asks the bigger questions:
- What does the data tell us?
- What patterns or trends can we identify?
- How can we use this information to solve real-world problems?
At its core, data analysis is about transforming numbers into knowledge. For instance, consider a geospatial application:
- Data Processing organizes satellite imagery by removing noise and aligning layers.
- Data Analysis uses this processed data to identify urban growth patterns, calculate the risk of natural disasters in specific areas, or optimize routes for a fleet of delivery vehicles.
Modern data analysis combines statistical methods, domain expertise, and cutting-edge tools to turn data into a powerful decision-making asset. It doesn’t just answer questions; it sparks new ones, driving continuous innovation and improvement.
Data Processing vs. Data Analysis: Key Differences
| Aspect | Data Processing | Data Analysis |
| Definition | The transformation of raw, unstructured data into a clean, structured, and usable format. | The examination and interpretation of processed data to extract meaningful insights. |
| Purpose | Prepares data for further use by organizing, cleaning, and structuring it. | Provides answers to questions, uncovers patterns, and supports decision-making. |
| Stages in Workflow | Comes before data analysis in the data lifecycle. | Comes after data processing and uses processed data. |
| Focus | Focuses on technical tasks like cleaning, organizing, and validating data. | Focuses on drawing conclusions, generating insights, and identifying trends. |
| Methods Used | Includes cleaning, formatting, aggregation, and validation. | Includes statistical methods, geospatial analysis, and visualization. |
| Output | Organized and error-free data ready for analysis. | Insights, reports, models, or decisions based on the data. |
| Examples | – Cleaning satellite imagery by removing noise. – Aligning GIS layers for compatibility. – Merging datasets like traffic data and urban maps. | – Identifying high-risk areas for natural disasters using GIS. – Determining the most efficient delivery routes for a fleet. – Predicting urban growth patterns based on geospatial trends. |
Types of Data Analysis
Data analysis is not a one-size-fits-all process. Depending on your objectives, you might use one or more of these four types of analysis. Each serves a unique purpose, helping you uncover insights from different perspectives.
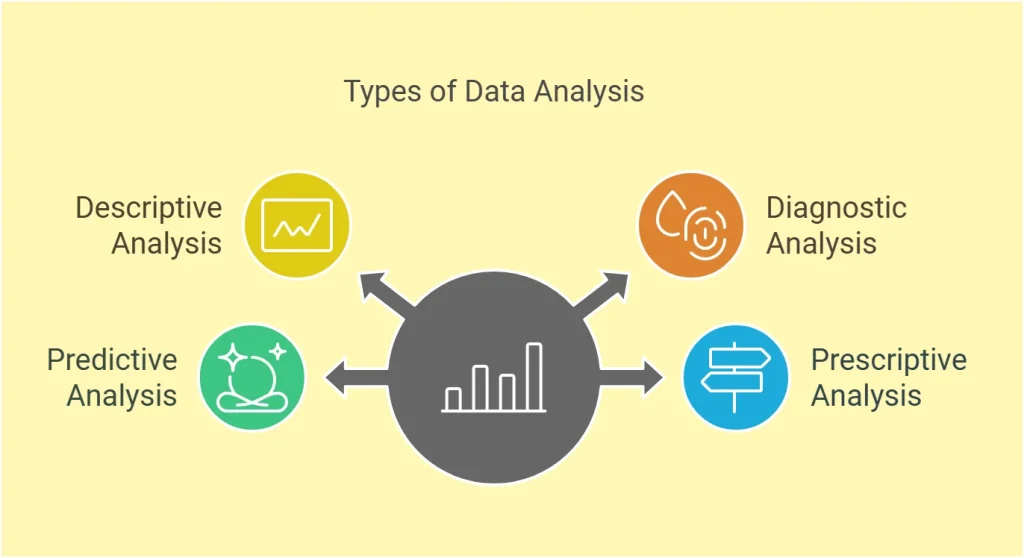
1. Descriptive Analysis: Understanding What Happened
Descriptive analysis focuses on summarizing historical data to provide a clear picture of what occurred over a specific time period. This is often the first step in data analysis, offering insights into trends, patterns, and overall performance.
Examples:
- Analyzing historical traffic patterns to identify the busiest routes in a city.
- Summarizing land use changes in a region over the past decade using satellite imagery.
- Generating reports on fleet performance, such as average delivery times or fuel consumption over a given period.
Key Tools: GIS software (e.g., QGIS, ArcGIS), Excel for basic summaries, Tableau for visualization.
Descriptive analysis doesn’t explain why something happened; instead, it establishes a foundation by answering what happened.
2. Diagnostic Analysis: Digging into the ‘Why’
Diagnostic analysis goes deeper, seeking to explain why certain events occurred. It explores relationships between variables to uncover root causes and contributing factors.
Examples:
- Investigating why certain regions experience higher vehicle breakdowns in fleet operations by correlating breakdown data with road quality or weather conditions.
- Exploring why deforestation is accelerating in specific areas by analyzing satellite imagery alongside economic activity data.
- Determining why delays occur on specific routes by analyzing traffic flow and vehicle tracking data.
Key Tools: GIS platforms for overlay analysis, Python (Pandas, NumPy) for correlating datasets, and SQL for querying large datasets.
Diagnostic analysis provides context and identifies the causes behind observed patterns.
3. Predictive Analysis: Forecasting What Might Happen
Predictive analysis uses historical data and modeling techniques to anticipate future events, trends, or risks. This is especially valuable for planning and proactive decision-making.
Examples:
- Forecasting future traffic congestion hotspots based on historical traffic and urban development trends.
- Predicting wildfire risks by analyzing vegetation density, weather conditions, and historical fire data.
- Anticipating delivery delays in fleet management due to seasonal traffic patterns or weather changes.
Key Tools: Machine learning algorithms (e.g., Scikit-learn, TensorFlow), GIS-based predictive models, and big data tools like Apache Spark.
Predictive analysis helps organizations prepare for the future by identifying potential challenges and opportunities.
4. Prescriptive Analysis: Recommending the Best Course of Action
Prescriptive analysis builds on predictive insights by suggesting the best actions to take. It often uses optimization algorithms and simulations to determine the most effective solution.
Examples:
- Recommending the most efficient delivery routes for fleet vehicles, considering current traffic conditions, delivery priorities, and fuel efficiency.
- Identifying optimal locations for new fire stations based on risk analysis, accessibility, and population density.
- Suggesting resource allocation strategies to mitigate flood risks in high-risk areas.
Key Tools: Optimization libraries (e.g., PuLP, OR-Tools), GIS tools for scenario modeling, and decision-support systems.
Prescriptive analysis is the most advanced form, providing actionable steps to achieve specific goals.
How They Work Together
In real-world applications, these types of analysis often complement each other. For example:
- Descriptive analysis shows a fleet’s fuel costs increased last quarter.
- Diagnostic analysis reveals that vehicles on specific routes consumed more fuel due to poor road conditions.
- Predictive analysis forecasts a further increase in fuel costs if those routes aren’t optimized.
- Prescriptive analysis recommends adjusting delivery schedules and prioritizing maintenance for fuel-efficient vehicles.
By understanding and applying these types of data analysis, businesses and organizations can tackle challenges more effectively while optimizing operations.
Steps in Data Analysis
Data analysis is a structured process that ensures insights are accurate, relevant, and actionable. Each step builds on the previous one, guiding you from raw data to impactful decisions.

1. Defining the Objective
The first step is to clearly identify the question or problem you want to solve. Without a defined objective, analysis can become unfocused and ineffective. A clear objective directs the data you collect and the techniques you use.
Examples:
- “Which routes should our fleet avoid during rush hour to minimize delays?”
- “How has urban sprawl impacted green spaces in the last decade?”
- “Which areas are at the highest risk for wildfire outbreaks based on historical data?”
2. Collecting and Processing Data
Once the objective is set, collect the relevant data and process it to ensure it is clean, well-structured, and ready for analysis. Data processing may involve removing noise from satellite imagery, aligning GIS layers, or merging data from multiple sources like traffic systems and environmental databases.
Examples:
- Cleaning GPS data from fleet trackers to remove duplicate entries.
- Preparing high-resolution satellite imagery by correcting distortions and aligning with spatial coordinates.
- Merging datasets on weather, vegetation, and topography for wildfire risk analysis.
3. Exploratory Data Analysis (EDA)
Exploratory Data Analysis (EDA) helps you understand your data, detect anomalies, and uncover preliminary patterns. This step often involves creating graphs, maps, and summary statistics to identify trends or unexpected results.
Examples:
- Using heat maps to visualize vehicle density in a city and spot congestion zones.
- Plotting land-use changes over time to identify areas experiencing rapid urbanization.
- Analyzing elevation data to locate steep slopes prone to landslides.
Key Tools: GIS platforms for spatial visualization, Python libraries like Matplotlib and Seaborn.
4. Applying Analytical Techniques
At this stage, you use statistical or computational techniques to answer your defined question. This could involve pattern detection, predictive modeling, or spatial analysis.
Examples:
- Using machine learning models to predict delivery delays based on historical traffic data.
- Running slope analysis to identify areas most susceptible to erosion.
- Applying clustering algorithms to group similar geographic areas based on population density and accessibility.
Key Tools: GIS software, Python (Scikit-learn, NumPy), and R.
5. Visualizing Results
Data visualization brings your analysis to life, presenting insights in an accessible format. This step is crucial for communicating findings to stakeholders and making complex data easy to understand.
Examples:
- Creating interactive dashboards that show real-time fleet performance and route efficiency.
- Generating 3D visualizations of urban growth to highlight its impact on nearby ecosystems.
- Designing fire risk maps that combine historical data, current conditions, and predictive models.
Key Tools: DashSi, Tableau, ArcGIS.
6. Interpreting Insights
Finally, interpret your findings and translate them into actionable recommendations. The key is to align your insights with the original objective, ensuring they address the problem effectively.
Examples:
- Recommending alternative fleet routes during peak hours to reduce travel time and fuel costs.
- Suggesting conservation measures in urban areas encroaching on green spaces.
- Advising on resource allocation for firefighting based on risk-prone zones identified in the analysis.
Effective interpretation ensures your analysis doesn’t just provide answers but also drives informed decision-making.
Challenges in Data Analysis
While data analysis offers immense value, it also comes with challenges that can impact the accuracy and effectiveness of insights. Addressing these challenges is crucial, especially in fields like geospatial analysis, fleet management, and GIS solutions.
1. Data Quality Issues
The accuracy of your analysis depends on the quality of your data. Inaccuracies such as missing values, duplicate entries, or outdated information can lead to unreliable results.
Solution: Prioritize data cleaning and validation during the processing stage. Regularly update datasets and use automated systems to detect and correct errors.
2. Complex Datasets
Many datasets, especially in GIS and geospatial analysis, are vast, unstructured, or come from multiple sources. Integrating and analyzing such data can be overwhelming and time-consuming.
Solution: Use robust data integration tools and standardized formats to simplify the process. Barsi tools like CETIA or LinkSi can streamline multi-source data management.
3. Interpretation Errors
Even when the data is clean and well-processed, misinterpreting analysis results can lead to poor decisions. Biases, assumptions, or a lack of domain expertise may skew insights.
Solution: Encourage collaboration between data analysts and domain experts. Use clear, unbiased visualization techniques to present findings and avoid misinterpretation.
Additional Challenges
- Scalability: Handling increasing volumes of geospatial and fleet data as operations grow.
- Timeliness: Ensuring real-time analysis for applications like traffic management or disaster response.
- Privacy Concerns: Managing sensitive data, such as location tracking, while adhering to privacy regulations.
Conclusion: Data Analysis as a Game-Changer
Data analysis bridges the gap between data processing and actionable decision-making. With the right tools and techniques, it transforms numbers into insights that can shape strategies, optimize processes, and forecast trends.
Looking to make your data even more powerful? Explore our next guide: Data Visualization: Turning Numbers into Stories, where we delve into how to communicate your findings effectively through compelling visuals that engage and inform.


